8th GradeNegative rate of changeabout 2 minCCSS HSF.IF.B.6Calculate and interpret the average rate of change of a function (presented symbolically or as a table) over a specified interval. Estimate the rate of change from a graph.CCSS 8.F.B.4Construct a function to model a linear relationship between two quantities. Determine the rate of change and initial value of the function from a description of a relationship or from two (x, y) values, including reading these from a table or from a graph. Interpret the rate of change and initial value of a linear function in terms of the situation it models, and in terms of its graph or a table of values.+0
See how a phone predicts empty, then find a pilot's point of no return.
Lesson Plan
Use linear functions with a negative rate of change to predict when a quantity reaches zero.
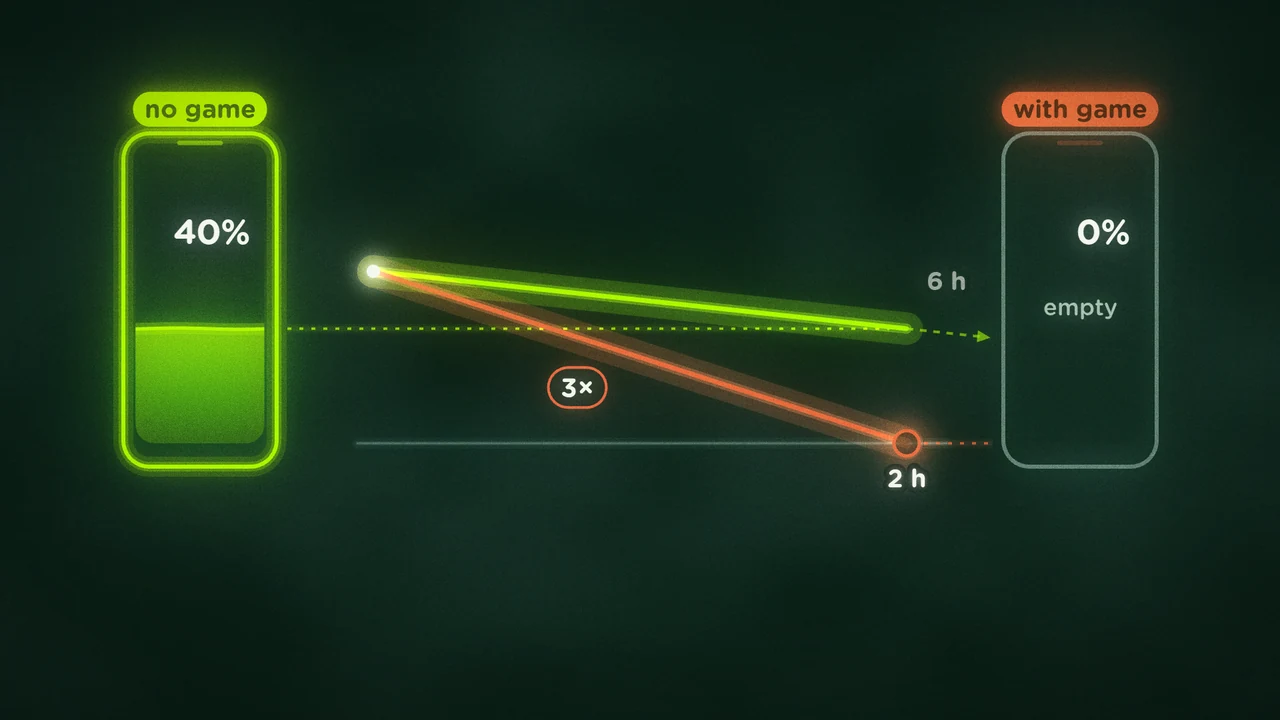
Question: Ask what students spot and what they are curious about. Read “What did the game change?” aloud. Have each student guess and say why.
Big idea: Pause. Ask a student to say the idea in their own words.
Question: Read “When is its last chance to turn back?” aloud. Have partners explain their guesses to each other.
Real-world application: Ask: Where else have you seen this?
Your turn: Have students try their own. Ask them to predict before they test.
How to run it
Whole classPut the lesson on the board. At each choice the class votes, then you select the winner.
SoloShare the link, QR code, or post to Google Classroom. Each student gets to take their own path.