Algebra 1Quadratic functionsabout 3 minCCSS HSF.IF.B.4For a function that models a relationship between two quantities, interpret key features of graphs and tables in terms of the quantities, and sketch graphs showing key features given a verbal description of the relationship. Key features include: intercepts; intervals where the function is increasing, decreasing, positive, or negative; relative maximums and minimums; symmetries; end behavior; and periodicity.CCSS HSF.IF.B.6Calculate and interpret the average rate of change of a function (presented symbolically or as a table) over a specified interval. Estimate the rate of change from a graph.+0
Time a rolling ball with water, then see why no one stays in the air for two seconds.
Lesson Plan
Explore quadratic functions and average rate of change through a falling object.
Question: Ask what students spot and what they are curious about. Read “Next beat: how far does it roll?” aloud. Have each student guess and say why.
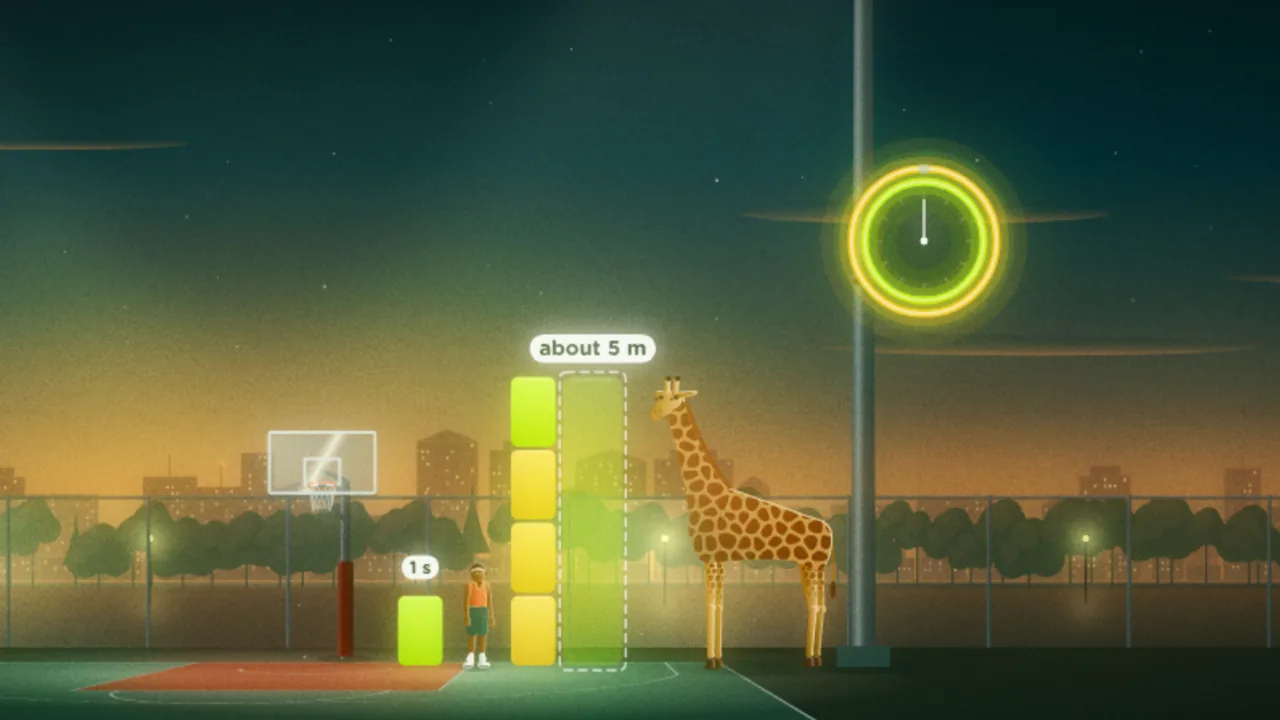
Question: Read “Twice as long in the air: how high?” aloud. Have partners explain their guesses to each other.
Real-world application: Ask: Where else have you seen this?
Your turn: Have students try their own. Ask them to predict before they test.
How to run it
Whole classPut the lesson on the board. At each choice the class votes, then you select the winner.
SoloShare the link, QR code, or post to Google Classroom. Each student gets to take their own path.